Wayflyer acquires Conjura to accelerate its AI product offering for small businesses (read more here)

eCommerce
Friday, October 17, 2025
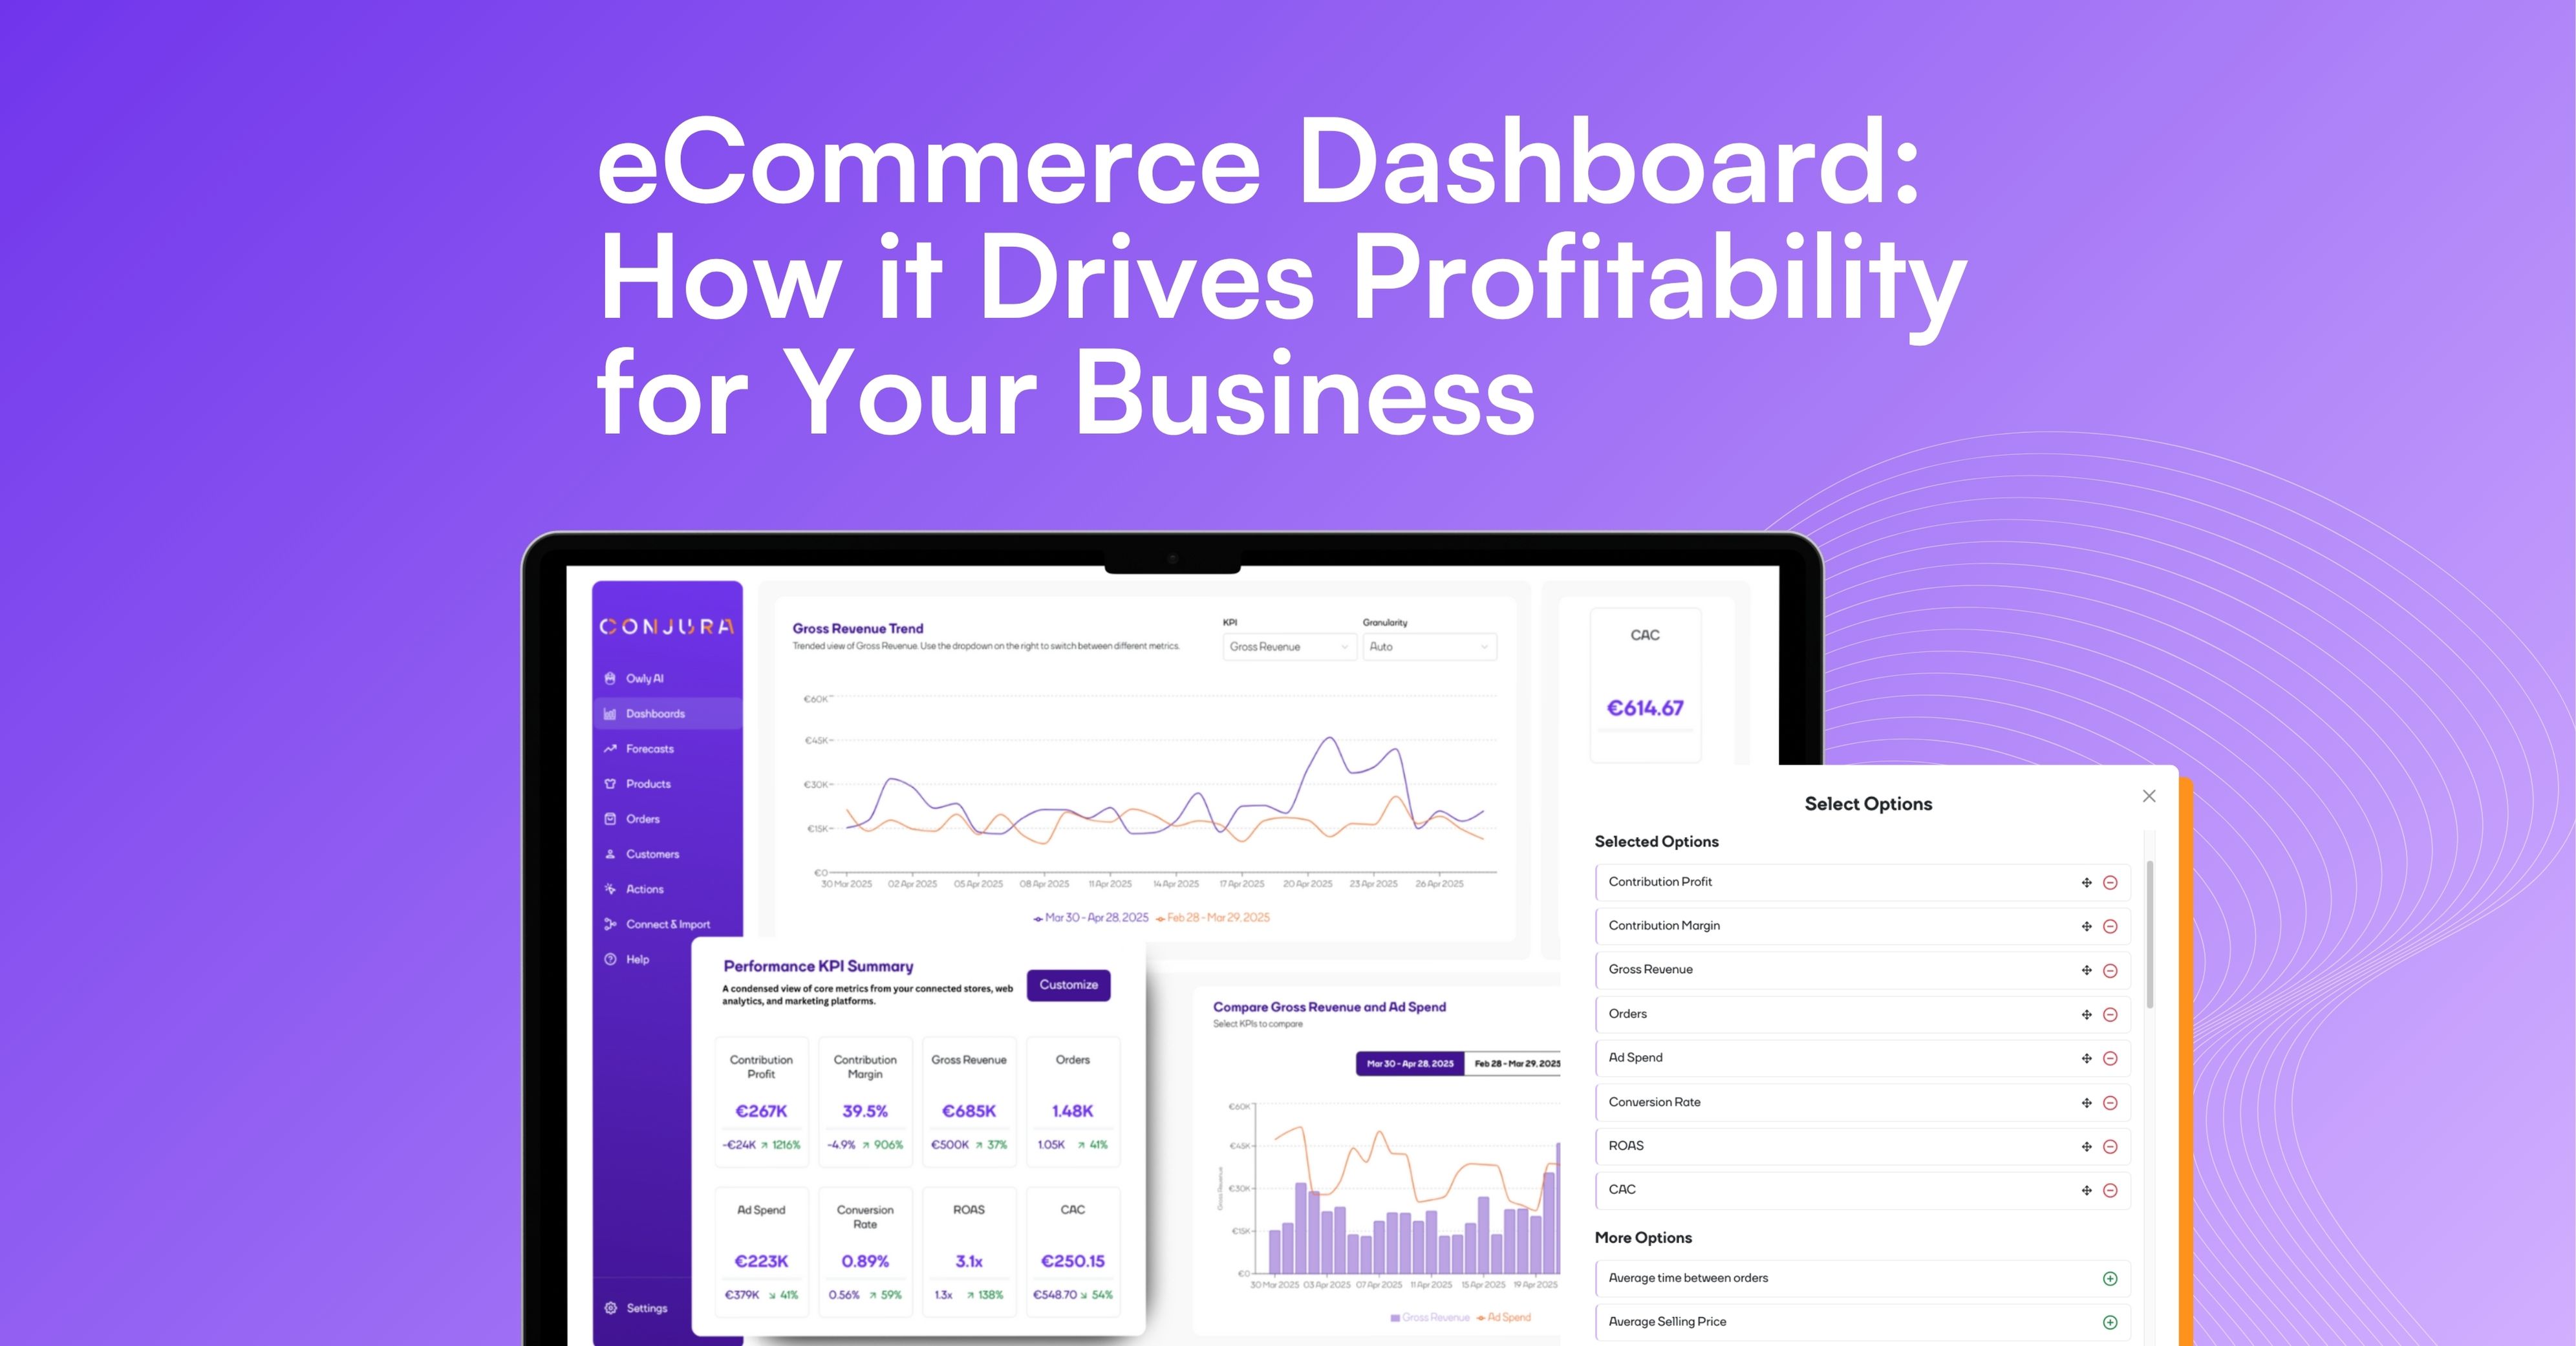
If you’re still juggling spreadsheets, exporting data from different tools, and manually calculating contribution margins, you’re not alone. But you’re also leaving money on the table. That's where eCommerce Dashboard comes into play.
Running an eCommerce business today means having access to more data than ever before. Every platform, from Shopify and Google Analytics to Meta Ads and TikTok - spits out charts, graphs, and metrics by the dozen. But with the luxury of more data comes its own challenges…
Cutting through the noise and finding out what’s really driving profit.
If you’re still juggling spreadsheets, exporting data from different tools, and manually calculating contribution margins, you’re not alone. But you’re also leaving money on the table.
That’s where an eCommerce dashboard built for decision-making (not just data viewing) becomes your most valuable growth tool.
An eCommerce dashboard is a tool that pulls together data from across your business - online store, marketing channels, marketplaces, customer behaviour, and operations - and displays the key metrics you need to run (and grow) your business.
But here’s the catch.
At one end of the spectrum, you’ve got basic dashboards that give you surface-level metrics like orders or revenue. At the other end, you've got integrated & unified performance dashboards that give you profitability insights down to the SKU level, help you allocate ad spend smarter, and tell you where your next best opportunity is.
If your dashboard doesn’t link marketing performance with product performance then you’re missing a trick. Here's why a purpose-built eCommerce analytics dashboard is critical to profitability:
Revenue is vanity, profit is sanity. Conjura's platform, for example, calculates Contribution Profit down to the individual SKU - subtracting ad spend, refunds, shipping, and more. That means you can quickly spot which products are actually driving your bottom line.
Not all products should be promoted equally. A product might be driving clicks but failing to convert profitably. With SKU-level ad spend tracking, you can reallocate budget away from underperformers and double down on high-ROI winners.
Why pour ad spend into a product that’s about to go out of stock? A proper dashboard combines sales velocity, stock levels, and profitability to guide smarter merchandising decisions.
Want to know which products attract customers who come back again and again? With dashboards that tie product performance to customer LTV, you can find the products that build loyalty, not just short-term sales.
In short, the right dashboard doesn’t just inform. It drives smarter decisions across every function of your business - marketing, merchandising, pricing, and operations.
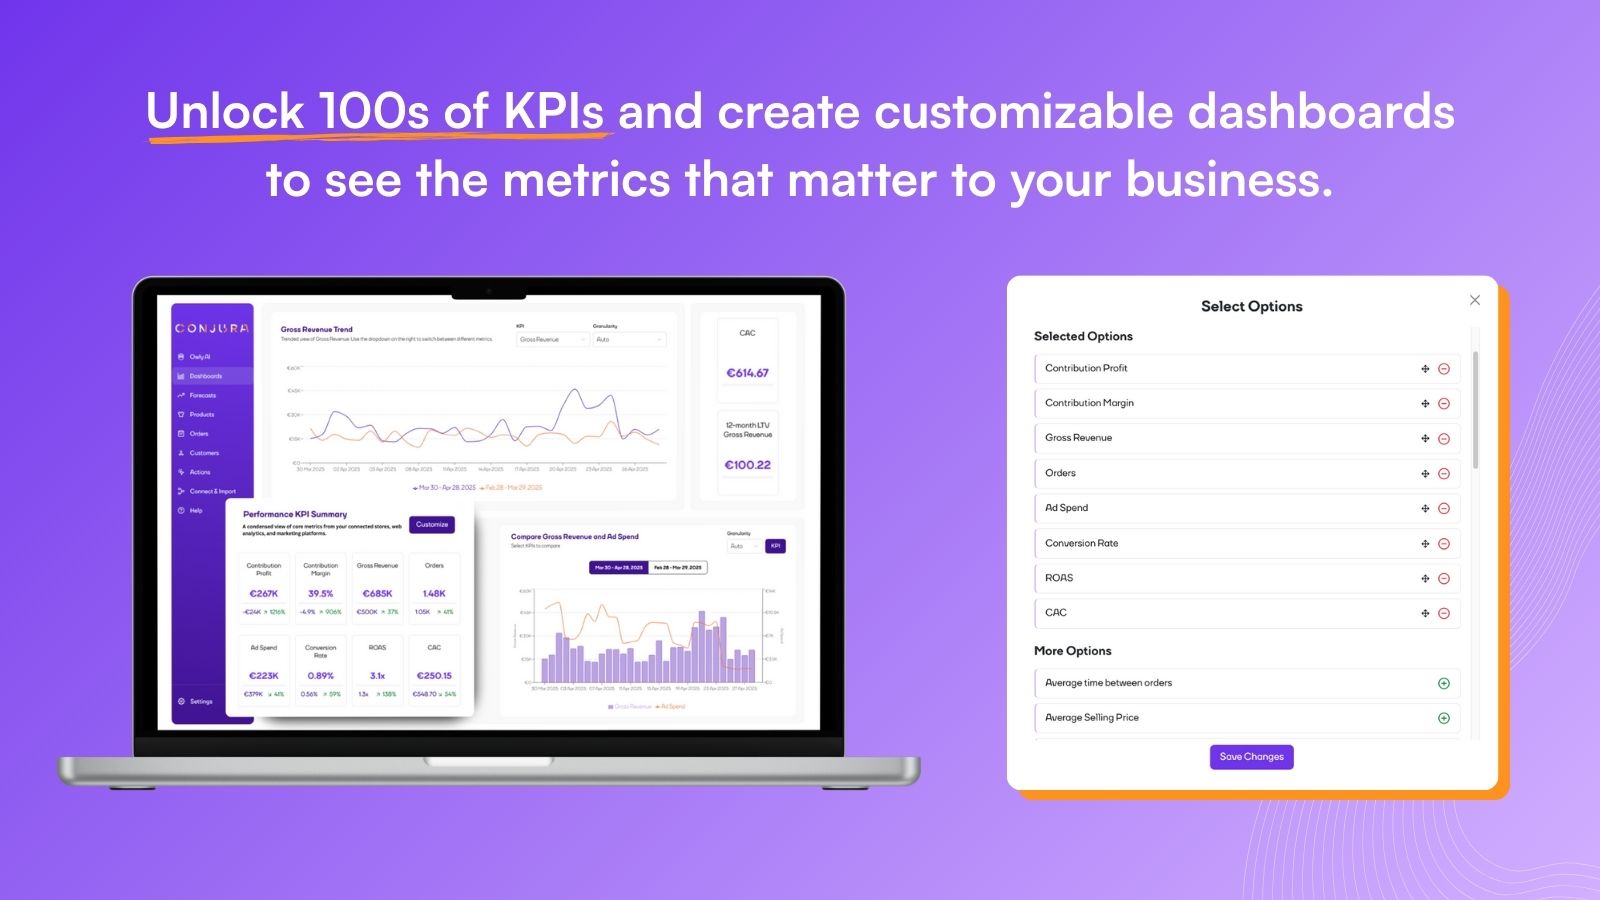
Let’s be honest, eCom metrics wildly vary in their importance to your business. You don’t need to track 47 KPIs; you need to track the ones that actually impact your profitability and growth.
Here are the KPIs that your eCommerce KPI dashboard should include:
The Conjura platform tracks all of these and more, giving you a 360-degree, omnichannel view of your business, from marketing funnel to repeat purchases.
Building your own dashboard sounds tempting. You hire a dev, pull in a Looker Studio or Power BI setup, and think you’ll save money long-term. But here’s the problem:
Custom builds are costly to develop, maintain, and adapt. Every time your marketing team changes campaign structure or a platform updates its API, your dashboard breaks.
Your time and budget are better spent growing your brand, not building and maintaining BI tools. Let the specialists handle the infrastructure.
Conjura’s dashboards aren’t just visual. They’re backed by a deep understanding of eCommerce logic, automatically calculating key metrics like LTV, contribution profit, and repurchase rates - and offering actionable recommendations.
If you're manually stitching together data sources, you risk inaccuracies, duplications, and missed insights. And let’s be honest - do you want your profit margin analysis relying on a fragile Google Sheet?
With a platform like Conjura, you get out-of-the-box accuracy, daily refreshes, and a team of experts behind the scenes constantly optimizing the platform. OH, and you will get access to our AI Agent, Owly AI, to streamline your analytics capabilities better than ever before.
So you’ve got Shopify. And GA4. And maybe a few dashboards in Meta Ads or Google Ads. That should be enough, right?
Not quite.
Google Analytics is great for traffic data, but terrible at tying spend to profitability. It can’t show SKU-level contribution margin or LTV. You’ll know how people arrive… but not if they’re worth acquiring.
Shopify dashboards show you sales, but they don’t account for what it cost to generate those sales. It’s like checking your bank balance without knowing your bills are due tomorrow.
Meta says your ROAS is 6x. Google says it’s 4x. Neither shows the blended view across channels, nor how that spend breaks down at a product or cohort level.
Without a centralised eCommerce analytics dashboard, you’re essentially guessing where to spend your money.
So now you know what a great eCommerce dashboard should look like, but where do you find one that actually ticks all the boxes?
Lucky for you, you’re on the right webpage!
Unlike generic dashboards or stitched-together spreadsheets, Conjura is built from the ground up for eCommerce profitability. It’s not just a data aggregator, it’s a decision engine.
Here’s why it stands out among the best eCommerce dashboards on the market:
Only Conjura accurately tracks ad spend down to the SKU level, including across channels like Google Shopping, Meta Ads, and TikTok. This means you can measure true profit by product, not just revenue. Most dashboards estimate this (badly). Conjura calculates it precisely.
It’s one thing to show you which products are low-margin. It’s another to tell you what to do about it. Conjura’s AI Agent, Owly AI, suggests real-world merchandising and marketing moves - like stopping ads on underperformers, increasing prices on high-converting products, or shifting budget to your top acquisition drivers. With Owly AI you can ask questions in plain English and get powerful answers in seconds, not hours. Build strategic reports and implementation plans in an instant! Think of it as having a merchandiser, analyst, and performance marketer rolled into one tool.
Connect your Shopify, BigCommerce, GA4, Meta, TikTok, Linnworks, CIn7, Amazon, and more - all with 1-click OAuth setup. Data syncs daily, so you're always acting on fresh insights. This is what unlocks true channel + product + customer intelligence in one place.
Not every team works the same way. With custom and saved dashboard views, filters, and metrics, you can tailor dashboards for your marketing team, your head of ops, or your CFO - all without exporting to Excel.
Don’t underestimate the power of a visual interface. Seeing product images alongside performance metrics makes Conjura’s dashboard actually pleasant to use. It’s like Shopify met Google Data Studio and had a better-looking, smarter baby.
Now, let’s talk about your new AI Data Analyst: Owly AI.
Owly is Conjura’s built-in AI agent, trained specifically on your eCommerce data. Think of it as a ChatGPT-style interface, but designed to answer the questions that matter to your business.
Ask things like:
Owly replies with clear, direct answers - powered by your own data - often with visual charts or links directly to the relevant dashboard view.
No SQL. No analyst delay. Just instant, intelligent answers.
Book your Owly AI demo today!
Ecommerce brands don’t need more data. What they need is better insight: the kind that’s fast, reliable, and immediately actionable. The goal isn’t to become a data analyst; it’s to run better campaigns, manage stock more intelligently, stop wasting ad spend on underperforming products, and ultimately grow profit, not just revenue.
That’s exactly what Conjura delivers, a platform purpose-built for eCommerce profitability. And with Owly, you’ve got an AI-powered analyst at your side, ready to surface key insights and recommendations without the delay, cost, or complexity of building an in-house data team.
Discover the latest eCommerce guides, articles and tips to help your brand grow.
Book A Demo
Book a demo with one of our team to discover the power of Conjura and how it can transform your business.
Revenue Increase
"I’m a big fan of Conjura and there’s so much more for us to keep getting from it.”
Kayla Wilson, Marketing Director @ Furniturebox

Explore the
Platform

plans
Get Started
plans
plans


Explore
Conjura


Unlock eCommerce performance data and gain insights that drive profit.
