Wayflyer acquires Conjura to accelerate its AI product offering for small businesses (read more here)

eCommerce
Monday, September 22, 2025
Our complete guide to key metrics for eCommerce, broken down into profitability, customer, product, marketing and operations KPIs that your brand should be tracking.
eCommerce metrics, KPIs, Insights...whatever you want to call them, are the cornerstone to successful and sustainable business growth. With D2C eCom brands juggling marketing channels, customer acquisition strategies, product performance insights, fulfillment timelines, and, of course, profit margins - it can be difficult to make sense of it all.
In this guide, we’ll break down the most important eCommerce metrics across five core areas of your business, and show you how to track them efficiently using a tool like Conjura (with a little help from our new AI Agent, Owly AI).
Let’s dive in. 🏊♂️
Metrics aren’t just numbers on a dashboard, they’re the lens through which you understand your business. In eCommerce, every decision you make, from budget allocation to product development, should be backed by data. But raw data alone isn’t enough. You need context. You need clarity. And you need consistency.
When you track the right metrics:
The danger lies in focusing on the wrong metrics, what we call "vanity metrics." These might make your performance look good on paper but do little to impact your bottom line. For example, high traffic (sessions) can feel exciting, but if your conversion rate is low, you’re not turning those visits into value. Similarly, having a massive email list sounds impressive—until you realize only 2% of those people ever open your campaigns.
Actionable metrics go deeper. They don’t just tell you what happened, they help you decide what to do next.
To build a solid analytics foundation, it's helpful to organise your metrics into key categories. These act as the pillars of performance that every DTC brand should focus on.
This includes all metrics related to how much money you’re making and more importantly, how much you’re keeping after costs. These are the financial health indicators of your business.
These metrics show how effectively you're attracting new customers and how well you're keeping them engaged and spending. Growth is important, but retention is where profitability lives.
Your product catalog isn’t static. You need visibility into how each SKU is performing, which ones are driving profit, and which are draining resources.
Marketing spend can quickly become a black hole. Efficiency metrics ensure your campaigns are working hard and delivering strong returns.
Logistics, shipping, and fulfillment can make or break a customer's experience (and your margin). These metrics are the often-forgotten side of eCommerce performance.
Each of these five categories works together to give you a holistic view of your business. Let’s dig into the first one.
When most people think of eCommerce metrics, revenue is the first thing that comes to mind. But total revenue alone doesn’t tell you much about the actual financial health of your business. That’s why it’s essential to track a combination of top-line and bottom-line performance.
Gross Revenue is your total sales figure before taxes, refunds, shipping, and discounts. It’s the headline number that reflects how much customers are spending. However, it's not always the best indicator of success on its own.
Net Revenue gives a clearer picture by stripping out taxes. It represents the actual cash flow entering your business from sales.
Contribution Profit takes it a step further. This is the revenue you retain after accounting for all variable costs associated with selling a product, think COGS, shipping, ad spend, and refunds. It shows you the real profit generated by your products and campaigns.
Contribution Margin % tells you how efficiently your business converts revenue into profit. If this number is low, you’re likely overspending on acquisition or underpricing your products.
Refund Rate can be a hidden killer. High refund rates erode profit and often point to issues with product quality, sizing, or shipping timelines. It’s essential to monitor this closely.
Gross Profit Margin looks at your revenue relative to the cost of goods sold (COGS) and other direct expenses, showing the health of your pricing and supply chain.
How to Track It: Conjura offers multiple ways to surface these insights. You can view Contribution Profit at a product level through the Product Table or assess your entire business’s health via the Performance Overview dashboard. Daily summaries also give quick snapshots of how profitability is trending.
Pro Tip: Most eCommerce businesses obsess over revenue. The best ones focus on Contribution Profit, especially per SKU. That’s where you’ll find the truth.
You’re not just selling products, you’re acquiring and nurturing customer relationships. If you’re only tracking orders and not looking at customer behaviour over time, you’re missing the bigger picture.
Customer Acquisition Cost (CAC) shows how much you’re spending to get each new customer. This includes ad spend, agency fees, influencer partnership, anything that goes into getting that first sale.
Customer Lifetime Value (LTV) measures how much revenue a customer brings in over a specific period (commonly 12 months). It’s one of the most important metrics in eCommerce. A high LTV means your customers are coming back and spending more.
LTV to CAC Ratio helps you understand your return on acquisition spend. If your CAC is £40 and LTV is £120, your ratio is 3:1, which is a good benchmark for profitable growth.
Repeat Rate shows how many customers are making more than one purchase. A strong repeat rate means you’re building loyalty and reducing dependency on new customer acquisition.
AOV (LTV Basis) calculates the average order value among your existing cohorts. This can help identify which segments or acquisition products generate high spenders.
New vs Existing Customer Revenue breaks down where your revenue is coming from. Are you overly reliant on new customers? Or is your growth being driven by loyal returners?
How to Track It: With Conjura’s LTV Analysis Dashboard, you can dig deep into cohort performance and track LTV by acquisition date, product, or channel. The New vs Existing Customers view reveals which segment is fueling growth (or dragging it down).
Pro Tip: LTV by acquisition product is a game-changer. It helps you double down on products that attract high-value customers and rethink those that don’t.
Products are the beating heart of your eCommerce business. Understanding which ones drive value and which ones are silently draining resources is essential.
Units Sold is a basic metric but still a vital one. It tells you what’s flying off the shelves and what’s collecting dust.
Sell-Through Rate compares what you’ve sold to your available inventory. A high sell-through rate is a sign of strong demand and efficient stock management. A low one can indicate overstocking or weak product-market fit.
Refund Rate at the product level reveals where issues might be hiding. If a single product has a much higher return rate than others, it may have quality or sizing issues that need to be addressed immediately.
Product Views measure interest, how often people are looking at a product. Low views may mean the product is buried or poorly merchandised, while high views and low conversions suggest a misalignment between expectations and reality.
Conversion Rate tells you how efficiently product views are turning into sales. It’s a direct indicator of product appeal and pricing strategy.
Gross/Net Revenue per Product helps you identify your top-performing SKUs in real, meaningful terms.
Ad Spend per Product (SKU-level) connects the dots between marketing and product performance. You need to know if you’re spending £100 to sell a £40 product.
How to Track It: Conjura’s Product Deep Dive dashboard gives you a full 360° view of individual SKU performance. Landing page attribution allows us to accurately assign ad spend to specific products, and the Cross-Product Revenue metric helps uncover those hidden gems driving overall store performance.
Pro Tip: Don’t judge a product solely on direct revenue. Some SKUs serve as gateway products that lead to high-value cross-sells. Identify and nurture those drivers.
Marketing is often your largest controllable cost, so tracking its performance is critical to protecting your margins.
ROAS (Return on Ad Spend) is the cornerstone metric here. It tells you how much revenue you earn for every £1 you spend on ads. But remember: revenue is not profit. High ROAS doesn’t always mean high profitability.
Click-Through Rate (CTR) indicates how compelling your creative and offer are. A high CTR means your ads are resonating, but it’s just the start of the funnel.
Conversion Rate shows how many people actually buy after landing on your site. Poor conversion here can negate strong CTRs and waste your ad spend.
Impressions, CPM, and CPC help you monitor top-of-funnel performance and benchmark costs. They’re especially useful when comparing across platforms or campaigns.
Platform vs Last-Click Attribution gives different perspectives on performance. Some platforms over-credit themselves; Conjura helps you compare attribution models so you can see the truth.
How to Track It: The Campaign Deepdive dashboard in Conjura offers granular performance data by campaign, channel, and SKU. You can also drill down into ROAS by attribution model and even see which campaigns drive the most valuable customers.
Pro Tip: Use Contribution Profit, not just ROAS, to judge ad performance. A campaign might look good on ROAS but be driving high refunds or low-margin orders.
Operations may not be the sexiest part of eCommerce, but they are foundational to both profitability and customer satisfaction. If your products are out of stock, delayed, or delivered poorly, it doesn't matter how good your marketing is, your brand takes a hit.
Stock Levels / Closing Stock gives you a real-time view of your inventory. Knowing what you have on hand allows for smarter restock decisions, prevents stockouts, and reduces the risk of over-ordering.
Sell-Through Rate is a vital efficiency metric. It tells you what percentage of inventory has been sold over a certain time. Low sell-through rates could indicate poor demand or marketing, while high sell-through with low stock levels could suggest missed opportunities and understocking.
Shipping Costs are often overlooked, but they’re one of the biggest line items in your operational expenses. Whether you absorb shipping or pass it on to the customer, understanding and optimising shipping costs directly affects your profit margins.
Refund Processing Time doesn’t just affect cash flow—it affects customer trust. A slow or clunky refund process can lead to poor reviews and lost repeat business. Tracking this metric ensures your post-purchase experience is as good as your marketing.
How to Track It: Conjura connects directly to your fulfillment and store platforms (like Shopify and BigCommerce) to pull in real-time stock and shipping data. For more custom needs, like manual shipping cost imports, Conjura’s data import tools make it easy to get a full picture of operational efficiency.
Spreadsheets are okay… until they’re not.
When you’re dealing with multiple SKUs, marketing channels, and customer segments, manually updating formulas and CSVs becomes a full-time job (and a risky one).
Spreadsheets are prone to errors, outdated data, and disconnected insights. You end up building monster files that no one else on your team understands, or trusts.
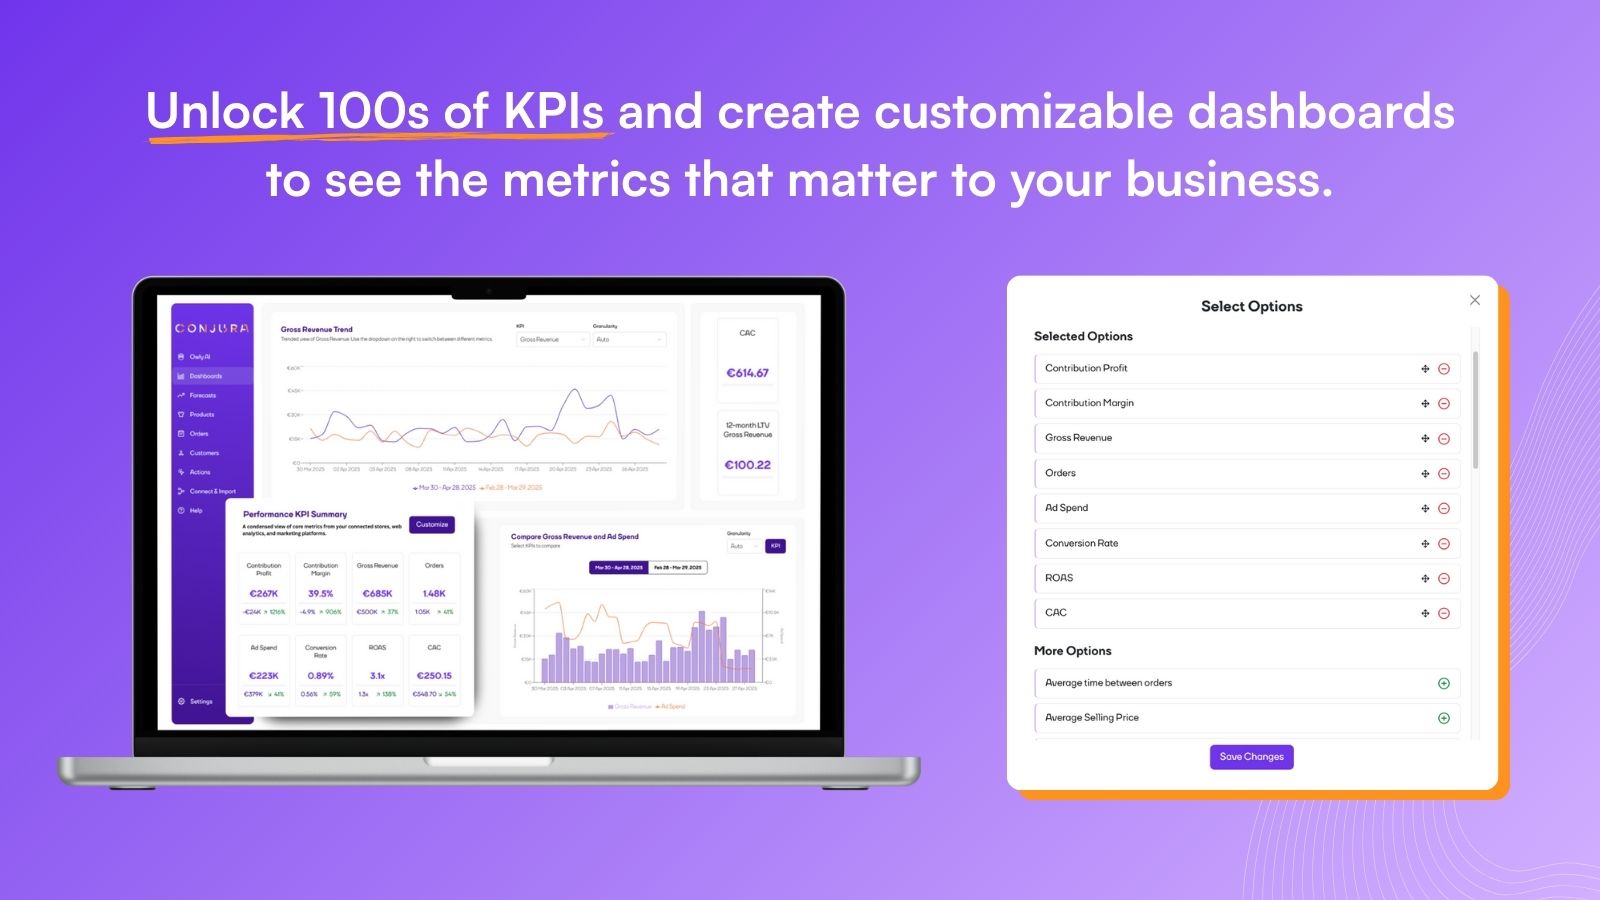
Conjura’s eCommerce metrics dashboards solves all of that. It pulls data from your store, marketing channels, analytics platforms, and inventory systems, then transforms it into live, actionable dashboards. Your team gets a single source of truth, and your decision-making becomes 10x faster.
Real-time visibility → better, faster decisions.
Conjura’s newest team member is your very own, personal AI Analytics Agent - readily available at your fingertips.
Owly AI helps brands track and interpret their data faster and more intelligently by:
Owly AI combines advanced analytics with a natural language interface, making it accessible to every team, whether you’re the CMO or the ops manager. It’s like having a senior data analyst working 24/7 - just without the coffee breaks.
Best of all, Owly doesn't just describe the problem, it suggests real solutions. If a campaign is overspending, or a product is underperforming, Owly tells you why and what to do next.
👉 Learn more about Owly AI here.
Tracking your eCommerce metrics is step one. But step two, the real magic, is turning those numbers into action.
Too many brands collect data without using it. With Conjura, you don’t just see your metrics, you understand them. You know where to focus. You know which levers to pull.
And with Owly AI, those insights are served up proactively, in plain English, with recommendations you can actually use.
Discover the latest eCommerce guides, articles and tips to help your brand grow.
Book A Demo
Book a demo with one of our team to discover the power of Conjura and how it can transform your business.
Revenue Increase
"I’m a big fan of Conjura and there’s so much more for us to keep getting from it.”
Kayla Wilson, Marketing Director @ Furniturebox

Explore the
Platform

plans
Get Started
plans
plans


Explore
Conjura


Unlock eCommerce performance data and gain insights that drive profit.
