Wayflyer acquires Conjura to accelerate its AI product offering for small businesses (read more here)

eCommerce
Friday, July 25, 2025
ROAS is one of the most important eCommerce performance metrics. Here's what ROAS is, how to calculate ROAS and more top tips.
Imagine lighting a £50 note on fire every time someone clicks your ad but doesn’t convert. Painful, right?
That’s essentially what happens when you don’t track or optimize your Return on Ad Spend (ROAS). You’re spending, but not always earning. ROAS is one of the most important eCommerce performance metrics, and yet, many brands either miscalculate it or obsess over the wrong benchmarks.
In this article, we’ll break down exactly what ROAS is, how to calculate it, what counts as a “good ROAS” in 2025, and most importantly, how to optimize it for profit.
Let’s dig in.
ROAS stands for Return on Ad Spend. It tells you how much revenue your business earns for every pound (or dollar, or euro) spent on advertising.
It’s a simple ratio:
If you spend £1 on ads and make £4 in sales from those ads, your ROAS is 4.0
At face value, ROAS seems like a no-brainer performance metric, but it’s only part of the profitability picture. Unlike Return on Investment (ROI), ROAS doesn’t account for your profit margins, shipping costs, or customer service overheads. It's a revenue measure, not a profit one.
Still, as a high-level view of ad effectiveness, ROAS is a key metric to track, especially when optimized at the channel, campaign, or even SKU level (more on that later).
Let’s get technical. The formula for calculating ROAS is:

For example:
Let’s say you spent £5,000 on a Meta Ads campaign and generated £20,000 in sales directly attributed to those ads. Your ROAS would be:
£20,000 ÷ £5,000 = 4.0
This means for every £1 spent, you earned £4 back.
Important note: You should only count attributed revenue - sales that clearly came from the ad spend in question. Mixing in organic or returning customer revenue will inflate your ROAS and give you a false sense of performance.
The answer is it depends. But let’s get specific.
Here's what the averages and targets look like across the industry
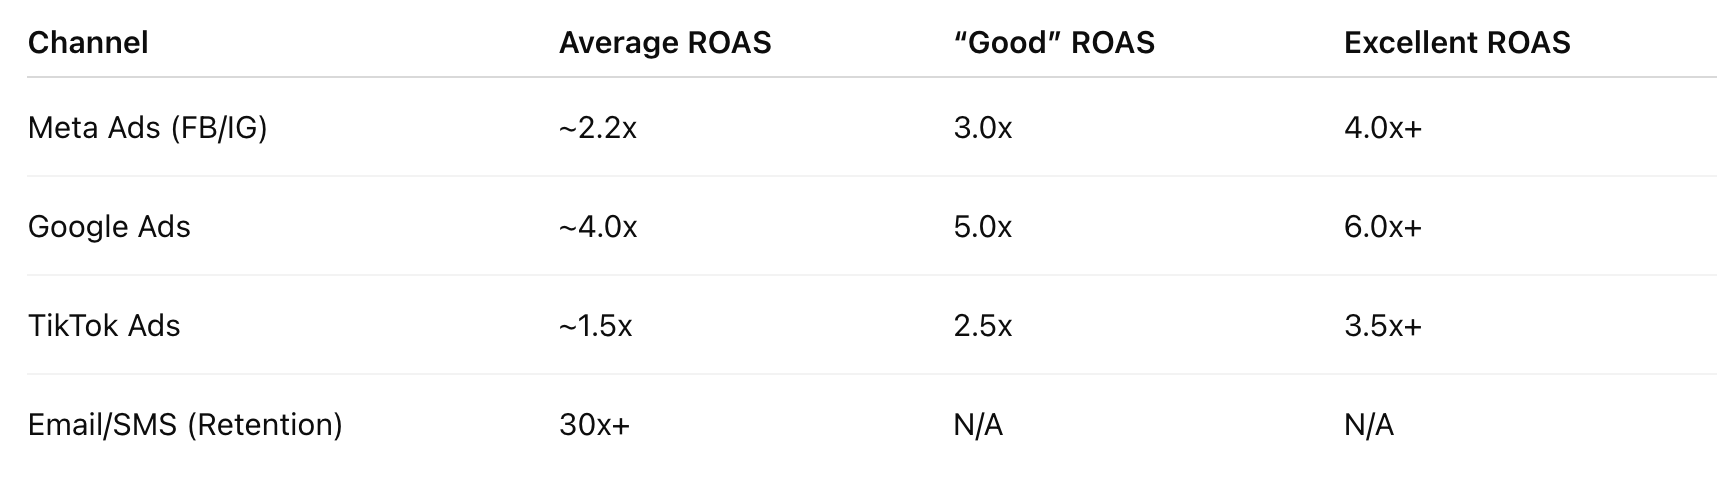
Rule of thumb: For eCommerce brands with 60–70% gross margins, a 3.0x ROAS is often breakeven. Anything higher contributes to profit.
But be careful: chasing a “good” ROAS can lead to under-investing in brand-building or retention campaigns. In many cases, lower ROAS campaigns with long-term payback (like new customer acquisition) are critical to scaling sustainably.
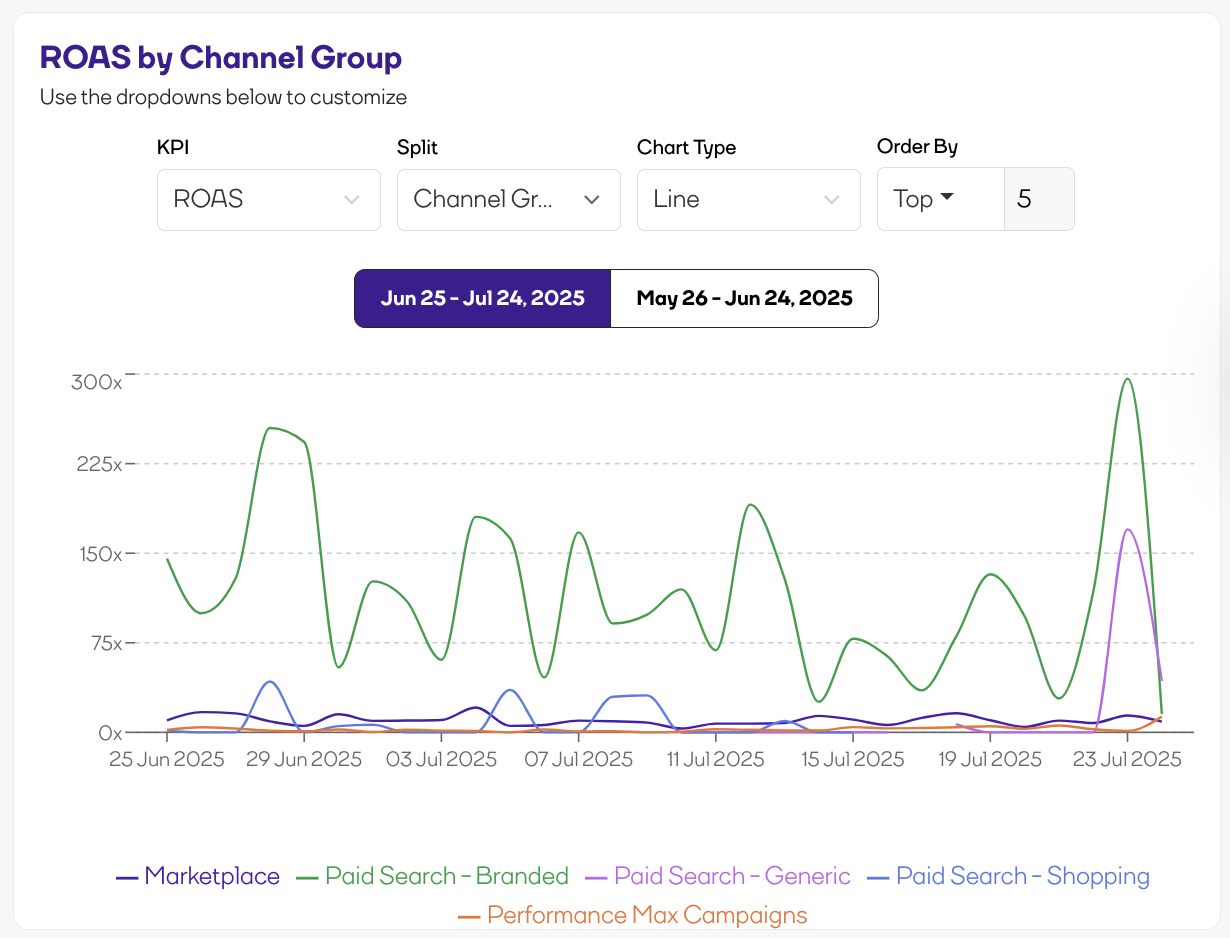
Most platforms show you a ROAS number. But they don’t tell you if it’s actually making you money.
That’s where Conjura is different.
Here’s how it works:
We unify performance across Meta, Google, TikTok, Amazon, Shopify (and more), so ROAS reflects total ad impact - no double counting, no blind spots.
We don’t just stop at campaign-level ROAS. Conjura shows ROAS per product, so you can identify which SKUs are ad efficient and which are profit killers.
We calculate your true breakeven ROAS based on your cost of goods sold (COGS), fulfilment, and customer acquisition costs.
Even better, Conjura layers ROAS with Contribution Profit, giving you a richer view of whether a campaign is profitable after factoring in product costs, refunds, and discounts.
You might see a campaign with a 3.5x ROAS, but once returns and COGS are factored in, it could be losing money. Conjura surfaces that automatically.
The result? You can confidently scale the campaigns, audiences, and products that drive real, bankable profit, not just top-line revenue.
Here’s the problem with ROAS: it’s blind to context.
Let’s say you run two campaigns:
Which is better?
You might say Campaign A, until you learn that it was promoting a low-margin product with high returns, while Campaign B sold high-margin bestsellers with great LTV.
ROAS doesn’t factor in:
That’s why we always recommend pairing ROAS with Contribution Profit and SKU-level attribution, two areas where Conjura goes deeper than other analytics platforms. When you evaluate ROAS in context, you make smarter decisions about where to spend next.
Ready to optimize? Here are eight tactical, data-backed methods to increase your ROAS and bottom line:
Use exclusions to avoid retargeting buyers who’ve already converted. Build lookalikes from high-LTV cohorts, not just one-time purchasers.
Refresh your ad creatives every 2–3 weeks. Run A/B tests across formats, headlines, and visuals. Stale ads = expensive clicks.
Split-test bundles, discounts, or tiered pricing. A 10% off promo might tank margins, but a 2-for-1 may increase AOV and conversion.
Meta might over-credit sales. Use Conjura or post-purchase surveys to validate whether your “top-performing” campaigns are actually driving incremental value.
Stop treating all products equally. Use tools like Conjura’s Expanded Product Table to see which SKUs drive profitable ROAS and which waste ad budget.
Your ad might be 🔥 but if your site takes 6 seconds to load, bounce rates will wreck your ROAS. Aim for sub-2 seconds mobile load.
Higher LTV = more room to spend on acquisition. Use email, SMS, and loyalty programs to drive second purchases and higher lifetime ROAS.
Don’t “set and forget” your ad budgets. Use weekly ROAS and profit heatmaps to shift spend to campaigns or products with the highest contribution margin.
Even experienced marketers can fudge their ROAS figures, sometimes by accident, sometimes to make reports look prettier (we won’t tell). Here are a few common pitfalls to avoid:
Avoid these traps and your ROAS will become a far more reliable compass, not just a vanity metric.
Understanding ROAS is one thing, but acting on it every day is what drives real results. That’s where Conjura steps in. Our platform brings together all your eCommerce and marketing data, ad spend, revenue, SKU-level margins and retention performance into a single, actionable view.
You’ll see which campaigns truly drive profit, optimize spend at the product level, and spot low-performing ads before they eat into your margins. Best of all, you don’t need a data science team to make it work. Conjura delivers daily, plain-English insights you can act on immediately!
Discover the latest eCommerce guides, articles and tips to help your brand grow.
Book A Demo
Book a demo with one of our team to discover the power of Conjura and how it can transform your business.
Revenue Increase
"I’m a big fan of Conjura and there’s so much more for us to keep getting from it.”
Kayla Wilson, Marketing Director @ Furniturebox

Explore the
Platform

plans
Get Started
plans
plans


Explore
Conjura


Unlock eCommerce performance data and gain insights that drive profit.
