Wayflyer acquires Conjura to accelerate its AI product offering for small businesses (read more here)

eCommerce
Monday, July 14, 2025
Contribution margin is the single most important metric for understanding real product-level profitability. In this article we discuss what it is and how to calculate it.

If you’re running an eCommerce brand, you probably know your top-line revenue. You may even know your gross margin. But do you know how much profit is actually left after you cover all the real, everyday costs that come with selling a product - like ad spend, shipping, refunds, and marketplace fees?
Spoiler: that number is rarely as healthy as your current analytics makes it look.
You might see a 60% margin in your Shopify dashboard and a 4x ROAS in Meta, but your actual cash in the bank says otherwise. Why? Because those numbers don’t include the full story, they ignore the true costs that eat into your profit with every sale. That’s where contribution margin comes in.
Contribution margin is the single most important metric for understanding real product-level profitability. It tells you exactly how much money each SKU or campaign is leaving behind after it’s paid its way. And unlike gross margin or net profit, it’s specific, actionable, and fully within your control.
So whether you’re a spreadsheet ninja, a finance-first founder, or just tired of the analytical unknown, this guide will help you finally nail down your true margins and unlock profit you didn’t even know you were losing.
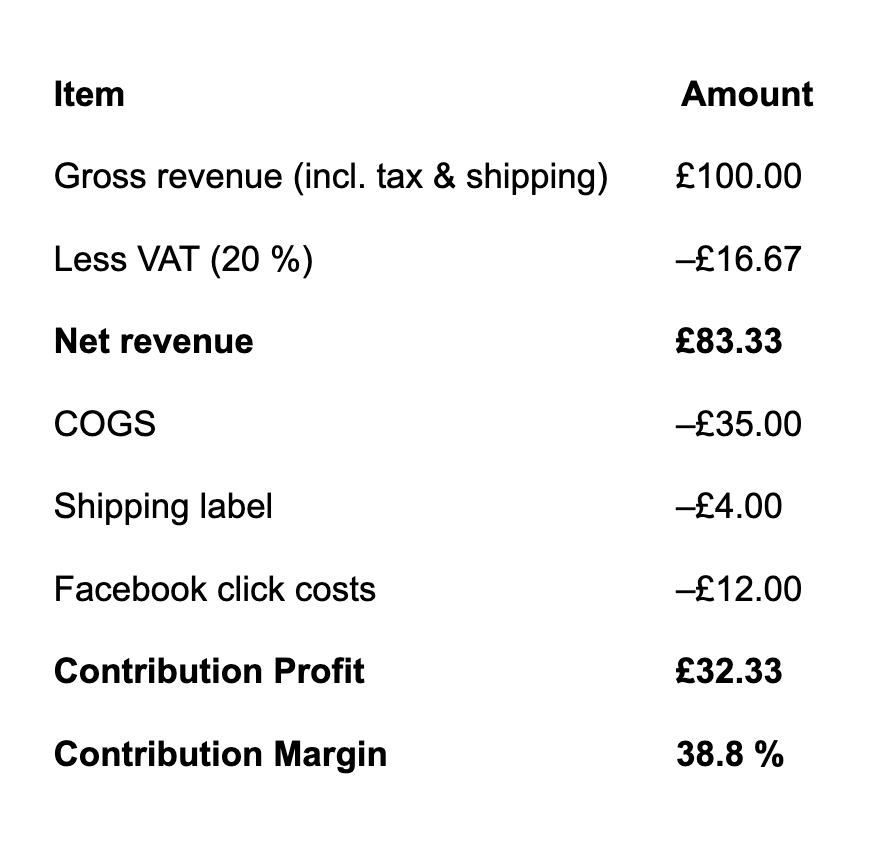
Think of contribution margin as the money that’s still sitting on the table after a product has pulled its weight and paid every bill that can be traced directly back to that product. Those bills include classic line-items like cost of goods sold (COGS) - raw materials, manufacturing, packaging, as well as the often-forgotten extras that quietly nibble away at your profit: shipping labels and fulfilment fees, payment-provider charges, refunds, click costs from Meta or TikTok, coupon redemptions, and marketplace commissions that Amazon or eBay skim before you ever see the cash.
Once you’ve stripped those costs out of net revenue (gross sales minus VAT/GST and any customer-paid shipping), what you’re left with is contribution profit. Express that figure as a percentage of net revenue, and voilà, you have contribution margin %. In other words, if your margin reads 42 %, it means forty-two pence of every pound (or cents of every dollar/euro) from that SKU or channel is available to cover overheads, pay salaries, fuel growth experiments, or simply pad the bank account.
Why does this metric matter more than the numbers Shopify cheerfully shows on its default dashboard? Because contribution margin focuses only on costs you can actually influence - the levers you can push or pull tomorrow: renegotiate freight rates, tweak Meta targeting, switch to lighter packaging.
That places contribution margin in a sweet Goldilocks zone between gross margin (usually too rosy - doesn’t count ad spend or fulfilment) and net profit (often too bleak - burdened with CFO salaries and office snacks). In practice, it becomes your decision-making Swiss Army knife:
To calculate contribution margin, you need two building blocks:

Our internal benchmarks show brands that switch from “gross margin” to contribution margin optimize budgets and add an average +19 % profit per SKU within the first quarter.
Shopify tells you you’re running a healthy 60% margin. Meta Ads insists your ROAS is 4x. But your cash flow spreadsheet? It’s sobbing quietly in the corner. If you've ever felt like your dashboards are gaslighting you, you're not alone. Here’s why calculating true contribution margin is so difficult using default tools:
Shopify can store your COGS, but that’s where its visibility ends. It has no clue what you’re spending on Facebook clicks, influencer gifting, Amazon referral fees, or TikTok ad sets. So your “margin” looks great—until you remember you spent £4,000 on ads to sell £5,000 worth of product.
Selling through marketplaces like Amazon or eBay? Good luck unpicking their bundled fee reports. Warehouse handling, pick-pack-ship costs, commissions—they’re all lumped into mystery CSVs that require a cryptographer to interpret. These fees eat into your profit quietly, but aggressively.
Most platforms log refunds on the day they’re processed—not the date the original order was made. That means June’s top-selling product could be riddled with refunds recorded in July, making it impossible to accurately measure performance month by month.
Still manually stitching together exports from Shopify, Meta Ads, Amazon, and Google Analytics? That means VLOOKUPs, SUMIFs, pivot tables, and probably at least one colour-coded rage cell. Every manual step is a margin killer, not to mention a massive time drain.
Ad spend might update hourly, order data updates nightly, and refunds are a weekly batch job. So when you try to reconcile them all in one spreadsheet, the result is a messy mix of stale, mismatched, and misleading data.
Conjura removes the data-wrangling headache by pulling every direct-cost data source into one warehouse: Shopify/BigCommerce orders, GA4 sessions, Meta/Google/TikTok ad spend, Amazon seller fees and more.
What makes it special?
Margin is great for percentage-based comparisons, but sometimes you just want the hard cash number. Conjura shows both side-by-side: flip a toggle in the dashboard and see how much money (not %) each SKU or channel is contributing. Because the underlying Contribution Profit formula already contains every direct cost, you can be confident the pounds/euros you see on screen mirror reality.
If you’ve made it this far, you’ve level-upped from “margin-curious” to “margin-master.” You can now rattle off the definition of contribution margin in your sleep, work the formula without breaking a sweat, and diagnose exactly why default Shopify or marketplace dashboards quietly sabotage your bottom line. More importantly, you’ve seen how Conjura plugs every data leak and hands you a real-time, SKU-level view of what’s actually making money, no spreadsheets, no guesswork, no caffeine-fuelled all-nighters.
But knowledge only turns into extra cash when you put it to work. Imagine logging in tomorrow morning and spotting three products that look like heroes on revenue but villains on contribution margin. With a couple of clicks you pause their ads, bump the price, or negotiate cheaper fulfilment and by the end of the week you’ve rescued hundreds, maybe thousands, in profit that would’ve slipped away unnoticed. That’s the everyday super-power our users enjoy, and we’d love to hand you the cape.
Discover the latest eCommerce guides, articles and tips to help your brand grow.
Book A Demo
Book a demo with one of our team to discover the power of Conjura and how it can transform your business.
Revenue Increase
"I’m a big fan of Conjura and there’s so much more for us to keep getting from it.”
Kayla Wilson, Marketing Director @ Furniturebox

Explore the
Platform

plans
Get Started
plans
plans


Explore
Conjura


Unlock eCommerce performance data and gain insights that drive profit.
